 RSS Feed
 by Calculated Risk on 5/12/2021 04:00:00 PM
Wednesday, May 12, 2021
May 12th COVID-19 New Cases, Hospitalizations; Vaccinations at 40% of Capacity
According to the CDC, on Vaccinations. Total administered: 264,680,844, as of yesterday: 263,132,561. Day: 1.55 million. (U.S. Capacity is around 4 million per day)
1) 58.7% of the population over 18 has had at least one dose (70% goal by July 4th).
2) 116.4 million Americans are fully vaccinated (160 million goal)
Note: I'll stop posting this daily once all three of these criteria are met:
1) 70% of the population over 18 has had at least one dose of vaccine, and
2) new cases are under 5,000 per day, and
3) hospitalizations are below 3,000.
And check out COVID Act Now to see how each state is doing.
Almost 6,500 US deaths were reported so far in May due to COVID.
 Click on graph for larger image.
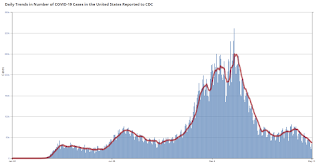
This graph shows the daily (columns) 7 day average (line) of positive tests reported.
Note: The ups and downs during the Winter surge were related to reporting delays due to the Thanksgiving and Christmas holidays.
This data is from the CDC.
 Click on graph for larger image.
This graph shows the daily (columns) 7 day average (line) of positive tests reported.
Note: The ups and downs during the Winter surge were related to reporting delays due to the Thanksgiving and Christmas holidays.
This data is from the CDC.
The 7-day average is 36,832, down from 38,265 yesterday, and down sharply from the recent peak of 69,881 on April 13, 2021. This is the lowest since September 14, 2020, but still above the post-summer surge low of 34,668.
The second graph shows the number of people hospitalized.
 This data is also from the CDC.
The CDC cautions that due to reporting delays, the area in grey will probably increase.
The current 7-day average is 30,718, down from 31,210 reported yesterday, but still above the post-summer surge low of 23,000.


