 RSS Feed
 by Calculated Risk on 5/07/2021 09:17:00 AM
Friday, May 07, 2021
Comments on April Employment Report
The headline jobs number in the April employment report was well below expectations, and employment for the previous two months was revised down.
Leisure and hospitality gained 331 thousand jobs. In March and April of 2020, leisure and hospitality lost 8.2 million jobs, and are now down 2.85 million jobs since February 2020. So leisure and hospitality has now added back about 65% of the jobs lost in March and April 2020.
Construction employment was unchanged in April, and State and Local education added 37 thousand jobs. Manufacturing lost 18 thousand jobs.
Earlier: April Employment Report: 266 Thousand Jobs, 6.1% Unemployment Rate
In April, the year-over-year employment change was 14.147 million jobs. This turned positive in April due to the sharp jobs losses in April 2020.
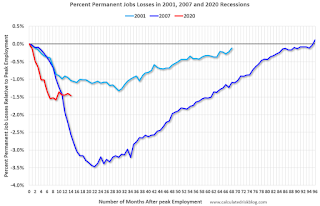
Permanent Job Losers
 Click on graph for larger image.
This graph shows permanent job losers as a percent of the pre-recession peak in employment through the April report. (ht Joe Weisenthal at Bloomberg).
Earlier: April Employment Report: 266 Thousand Jobs, 6.1% Unemployment Rate
In April, the year-over-year employment change was 14.147 million jobs. This turned positive in April due to the sharp jobs losses in April 2020.
Permanent Job Losers
 Click on graph for larger image.
This graph shows permanent job losers as a percent of the pre-recession peak in employment through the April report. (ht Joe Weisenthal at Bloomberg).
These jobs will likely be the hardest to recover.
This data is only available back to 1994, so there is only data for three recessions.
In April, the number of permanent job losers increased slightly to 3.529 million from 3.432 million in March.
Prime (25 to 54 Years Old) Participation
 Since the overall participation rate has declined due to cyclical (recession) and demographic (aging population, younger people staying in school) reasons, here is the employment-population ratio for the key working age group: 25 to 54 years old.
The prime working age will be key in the eventual recovery.
The 25 to 54 participation rate was unchanged in April at 81.3% from 81.3% in March, and the 25 to 54 employment population ratio increased to 76.9% from 76.8% in March.
Part Time for Economic Reasons
 From the BLS report:
These workers are included in the alternate measure of labor underutilization (U-6) that decreased to 10.4% from 10.7% in March. This is down from the record high in April 22.9% for this measure since 1994.
Unemployed over 26 Weeks
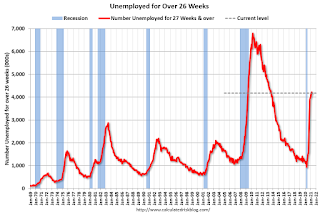 This graph shows the number of workers unemployed for 27 weeks or more.
According to the BLS, there are 4.183 million workers who have been unemployed for more than 26 weeks and still want a job, down from 4.218 million in March.
This does not include all the people that left the labor force. This will be a key measure to follow during the recovery.
Summary:
The headline monthly jobs number was well below expectations, and the previous two months were revised down by 78,000 combined. The headline unemployment rate increased to 6.1%.
This data is only available back to 1994, so there is only data for three recessions.
In April, the number of permanent job losers increased slightly to 3.529 million from 3.432 million in March.
Prime (25 to 54 Years Old) Participation
 Since the overall participation rate has declined due to cyclical (recession) and demographic (aging population, younger people staying in school) reasons, here is the employment-population ratio for the key working age group: 25 to 54 years old.
The prime working age will be key in the eventual recovery.
The 25 to 54 participation rate was unchanged in April at 81.3% from 81.3% in March, and the 25 to 54 employment population ratio increased to 76.9% from 76.8% in March.
Part Time for Economic Reasons
 From the BLS report:
"The number of persons employed part time for economic reasons decreased by 583,000 to 5.2 million in April. This decline reflected a drop in the number of people whose hours were cut due to slack work or business conditions. The number of persons employed part time for economic reasons is 845,000 higher than in February 2020. These individuals, who would have preferred full-time employment, were working part time because their hours had been reduced or they were unable to find full-time jobs."The number of persons working part time for economic reasons decreased in April to 5.243 million from 5.826 million in March.
These workers are included in the alternate measure of labor underutilization (U-6) that decreased to 10.4% from 10.7% in March. This is down from the record high in April 22.9% for this measure since 1994.
Unemployed over 26 Weeks
 This graph shows the number of workers unemployed for 27 weeks or more.
 According to the BLS, there are 4.183 million workers who have been unemployed for more than 26 weeks and still want a job, down from 4.218 million in March.
This does not include all the people that left the labor force. This will be a key measure to follow during the recovery.
Summary:
The headline monthly jobs number was well below expectations, and the previous two months were revised down by 78,000 combined. The headline unemployment rate increased to 6.1%.
This was a disappointing report , and there are still 8.2 million fewer jobs than in February 2020, and 3.5 million people have lost jobs permanently.


