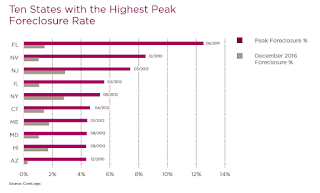
This graph for CoreLogic the Ten States with the highest peak foreclosure rate during the crisis, and the current foreclosure rate.
 Some states like Nevada and Florida have improved significantly. Other states, like New Jersey and New York, have only recovered slowly.
Here is a table based on data from the CoreLogic report showing completed foreclosure per year.
| Completed foreclosure by Year Source: CoreLogic | |
|---|---|
| Year | Completed Foreclosures |
| 2000 | 191,295 |
| 2001 | 183,437 |
| 2002 | 232,330 |
| 2003 | 255,010 |
| 2004 | 275,900 |
| 2005 | 293,541 |
| 2006 | 383,037 |
| 2007 | 592,622 |
| 2008 | 983,881 |
| 2009 | 1,035,033 |
| 2010 | 1,178,234 |
| 2011 | 958,957 |
| 2012 | 853,358 |
| 2013 | 679,923 |
| 2014 | 608,321 |
| 2015 | 506,609 |
| 2016 | 385,748 |