Note: I think I've improved the graphs since then! From 2005:
The following chart shows household mortgage debt as a % of GDP. Although mortgage debt has been increasing for years, the last four years have seen a tremendous increase in debt. Last year alone mortgage debt increased close to $800 Billion - almost 7% of GDP.
Source: Federal Reserve


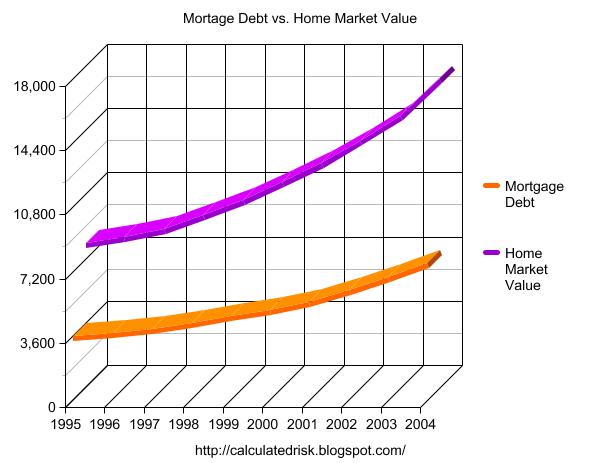
Some obervers have remarked that mortgage debt is still below 50% of household RE assets - and that is an accurate statement. In fact, if you plot mortgage debt vs. household RE assets everything looks reasonable.
Source: Federal Reserve
But lets plot household RE assets as a % of GDP.
Source: Federal Reserve
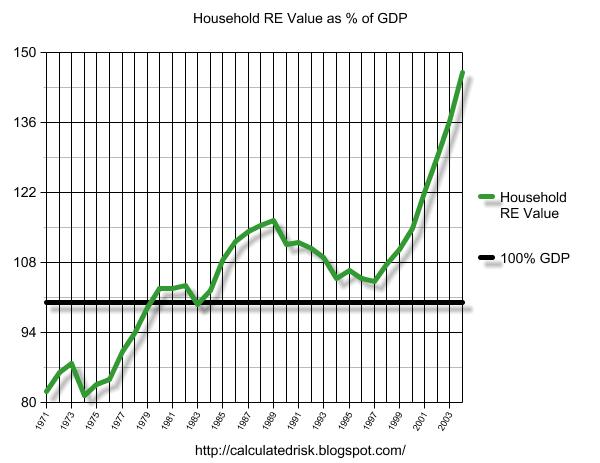
This final graph shows the potential problem. Household assets have really soared in the last few years. Many homeowners have refinanced their homes (or moved and taken cash out), in essence using their homes as an ATM.
It wouldn't take a RE bust to impact the general economy. Just a slowdown in both volume (to impact employment) and in prices (to slow down borrowing) might push the general economy into recession. An actual bust, especially with all of the extensive sub-prime lending, might cause a serious problem.
CR note: And a serious problem is what happened.