I expect YoY prices to slow further over the next several months.
It is also important to look at prices in real terms (inflation adjusted). Case-Shiller, CoreLogic and others report nominal house prices. As an example, if a house price was $200,000 in January 2000, the price would be close to $280,000 today adjusted for inflation (40%). That is why the second graph below is important - this shows "real" prices (adjusted for inflation).
Nominal House Prices
 The first graph shows the monthly Case-Shiller National Index SA, the monthly Case-Shiller Composite 20 SA, and the CoreLogic House Price Indexes (through July) in nominal terms as reported.
In nominal terms, the Case-Shiller National index (SA) is back to February 2005 levels, and the Case-Shiller Composite 20 Index (SA) is back to September 2004 levels, and the CoreLogic index (NSA) is back to February 2005.
Real House Prices
 The second graph shows the same three indexes in real terms (adjusted for inflation using CPI less Shelter). Note: some people use other inflation measures to adjust for real prices.
In real terms, the National index is back to July 2002 levels, the Composite 20 index is back to June 2002, and the CoreLogic index back to March 2003.
In real terms, house prices are back to early '00s levels.
Price-to-Rent
In October 2004, Fed economist John Krainer and researcher Chishen Wei wrote a Fed letter on price to rent ratios: House Prices and Fundamental Value. Kainer and Wei presented a price-to-rent ratio using the OFHEO house price index and the Owners' Equivalent Rent (OER) from the BLS.
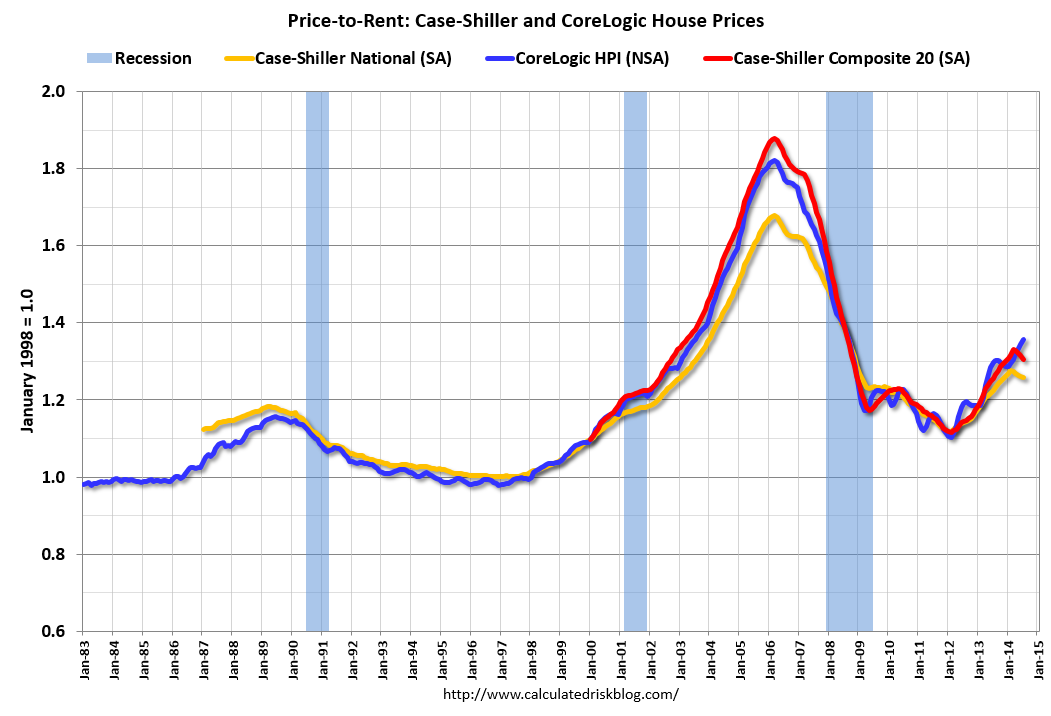 Here is a similar graph using the Case-Shiller National, Composite 20 and CoreLogic House Price Indexes.
This graph shows the price to rent ratio (January 1998 = 1.0).
On a price-to-rent basis, the Case-Shiller National index is back to December 2002 levels, the Composite 20 index is back to September 2002 levels, and the CoreLogic index is back to July 2003.
In real terms, and as a price-to-rent ratio, prices are mostly back to early 2000 levels.