by Calculated Risk on 3/07/2013 10:31:00 AM
Thursday, March 07, 2013
LPS: Mortgage Delinquencies decline in January, "Non-Judicial States’ Pipeline Ratios Extending Due to Legislative, Legal Actions"
LPS released their Mortgage Monitor report for January today. According to LPS, 7.03% of mortgages were delinquent in January, down from 7.17% in December, and down from 7.67% in January 2012.
LPS reports that 3.41% of mortgages were in the foreclosure process, down from 3.44% in December, and down from 4.23% in January 2012.
This gives a total of 10.44% delinquent or in foreclosure. It breaks down as:
• 1,974,000 properties that are 30 or more days, and less than 90 days past due, but not in foreclosure.
• 1,531,000 properties that are 90 or more days delinquent, but not in foreclosure.
• 1,703,000 loans in foreclosure process.
For a total of 5,208,000 loans delinquent or in foreclosure in January. This is down from 6,082,000 in January 2012.
This following graph from LPS shows Foreclosure Starts and Foreclosure Sales.
 Click on graph for larger image.
From LPS:
The January Mortgage Monitor report released by Lender Processing Services found significant differences continue in foreclosure pipelines between states with judicial and non-judicial foreclosure processes. Though both foreclosure starts and sales rates have been relatively volatile at the national level due to the effects of regional processes and compliance issues, the foreclosure inventory in judicial states remains three times that of non-judicial states. However, according to LPS Applied Analytics Senior Vice President Herb Blecher, even this now-familiar judicial/non-judicial dichotomy is not as clearly defined as it once was.
“On average,” Blecher said, “pipeline ratios – the rate at which states are currently working through their existing backlog of loans either in foreclosure or serious delinquency – are almost twice as high in judicial states than non-judicial states. At today’s rate of foreclosure sales, it will take 62 months to clear the inventory in judicial states as compared to 32 months in non-judicial states. A few judicial states – New York and New Jersey in particular – have such extreme backlogs that their problem-loan pipelines would take decades to clear if nothing were to change.
“More recently, certain non-judicial states, such as Massachusetts and Nevada, have enacted ‘judicial-like’ legislative and/or legal actions which have greatly extended their pipeline ratios. Nevada’s ‘time to clear’ has extended from 27 months in January 2012 to 57 months as of January 2013. The change in Massachusetts has been even more pronounced. Since June of last year, its pipeline ratio has gone from 75 to 171 months. As California’s recently enacted Homeowner’s Bill of Rights is closely modeled on the Nevada legislation, we’ll be watching that state closely over the coming months to gauge its impact, as well.”
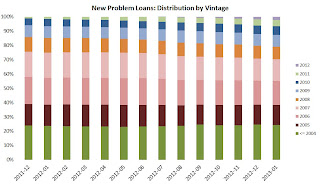
 The second graph from LPS shows new problem loans by vintage.
 Even after all these years, most of the problem are still from the "bubble" years. Recent vintage loans are performing well. For recovery, the key is to clear the backlog of non-performing loans from the bubble years. Making non-judicial states "judicial-like" is extending the pipelines and slowing the recovery.
CR Note: Several years ago I argued many foreclosures were a tragedy, but it was not a tragedy for someone to "lose their home" if they put no money down or if they had borrowed all the equity from their home. Unfortunately policymakers never recognized that distinction, and are still implementing policies to slow the foreclosure process.
There is much more in the mortgage monitor.


