by Calculated Risk on 10/02/2012 07:25:00 PM
Tuesday, October 02, 2012
Housing: Inventory down 21% year-over-year in early October
Here is another update using inventory numbers from HousingTracker / DeptofNumbers to track changes in listed inventory. Tom Lawler mentioned this last year.
According to the deptofnumbers.com for (54 metro areas), inventory is off 21.4% compared to the same week last year. Unfortunately the deptofnumbers only started tracking inventory in April 2006.
This graph shows the NAR estimate of existing home inventory through August (left axis) and the HousingTracker data for the 54 metro areas through early October.
 Click on graph for larger image.
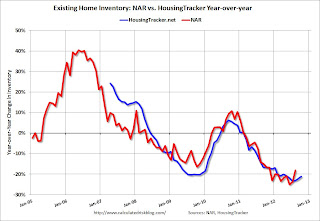
Since the NAR released their revisions for sales and inventory last year, the NAR and HousingTracker inventory numbers have tracked pretty well.
On a seasonal basis, housing inventory usually bottoms in December and January and then increases through the summer. Inventory only increased a little this spring and has been declining for the last five months by this measure. It looks like inventory peaked early this year.
The second graph shows the year-over-year change in inventory for both the NAR and HousingTracker.
 HousingTracker reported that the early October listings, for the 54 metro areas, declined 21.4% from the same period last year.
The year-over-year declines will probably start to get smaller since inventory is already pretty low. I doubt we will see 20% year-over-year declines next summer!


