by Calculated Risk on 6/05/2012 09:22:00 AM
Tuesday, June 05, 2012
CoreLogic: House Price Index increases in April, Up 1.1% Year-over-year
Notes: This CoreLogic House Price Index report is for April. The Case-Shiller index released last week was for March. Case-Shiller is currently the most followed house price index, however CoreLogic is used by the Federal Reserve and is followed by many analysts. The CoreLogic HPI is a three month weighted average and is not seasonally adjusted (NSA).
From CoreLogic: CoreLogic® Home Price Index Shows Year-Over-Year Increase of Just Over One Percent
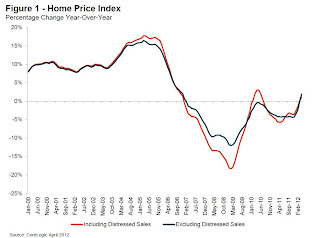
Home prices nationwide, including distressed sales, increased on a year-over-year basis by 1.1 percent in April 2012 compared to April 2011. This was the second consecutive year-over-year increase this year, and the first time two consecutive increases have occurred since June 2010. On a month-over-month basis, home prices, including distressed sales, increased by 2.2 percent in April 2012. This marks the second consecutive month-over-month increase this year.
Excluding distressed sales, prices increased 2.6 percent in April 2012 compared to March 2012, the third month-over-month increase in a row. The CoreLogic HPI also shows that year-over-year prices, excluding distressed sales, rose by 1.9 percent in April 2012 compared to April 2011. Distressed sales include short sales and real estate owned (REO) transactions.
Beginning with the April 2012 HPI report, CoreLogic is introducing a ... pending HPI that provides the most current indication of trends in home prices. The pending HPI indicates that house prices will rise by at least another 2.0 percent, from April to May. Pending HPI is based on Multiple Listing Service (MLS) data that measure price changes in the most recent month.
“We see the consistent month-over-month increases within our HPI and Pending HPI as one sign that the housing market is stabilizing,” said Anand Nallathambi, president and chief executive officer of CoreLogic. “Home prices are responding to a restricted supply that will likely exist for some time to come—an optimistic sign for the future of our industry.”
 Click on graph for larger image.
 This graph shows the national CoreLogic HPI data since 1976. January 2000 = 100.
The index was up 2.2% in April, and is up 1.1% over the last year.
The index is off 32% from the peak - and is just above the post-bubble low set two months ago.
 The second graph is from CoreLogic. The year-over-year comparison has turned positive.
Excluding the tax credit period, this is the first year-over-year increase since 2006 (March was revised up to a year-over-year increase too). This "stabilization" of house prices is a significant story.


