by Calculated Risk on 12/29/2011 07:53:00 PM
Thursday, December 29, 2011
Gasoline Prices and Brent WTI Spread
The year is almost over and once again a key downside risk for the economy is high gasoline prices. According to Bloomberg, Brent Crude is up to $108.10 per barrel, while WTI is up to $99.76. These prices have kept gasoline prices high, and pushed down vehicle miles driven in the US.
Although prices were higher in the first half of 2008, it is possible that the average annual price for oil and gasoline in 2012 will see a new record high.
If the global economy really slows, oil and gasoline prices will probably fall - and probably offset some of the impact from lower exports. Unfortunately turmoil in the Middle East (this time with Iran) might be pushing up oil prices.
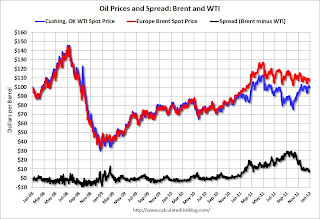
This following graph shows the prices for Brent and WTI over the last few years. Usually the prices track pretty closely, but the "glut" of oil at Cushing pushed down WTI prices relative to Brent.
 Click on graph for larger image.
The spread has narrowed over the last couple of months following the announcement of a partial reversal of the Seaway pipeline to transport crude oil from Cushing, Oklahoma, to the Gulf Coast (the pipeline is scheduled to be reversed in Q2 2012).
And below is a graph of gasoline prices. Gasoline prices have been slowly moving down since peaking in early May. Note: The graph below shows oil prices for WTI; gasoline prices in most of the U.S. are impacted more by Brent prices.
| Orange County Historical Gas Price Charts Provided by GasBuddy.com |


