by Calculated Risk on 8/02/2011 09:03:00 AM
Tuesday, August 02, 2011
Personal Income increased 0.1% in June, PCE decreased 0.2%
The BEA released the Personal Income and Outlays report for June:
Personal income increased $18.7 billion, or 0.1 percent ... Personal consumption expenditures (PCE) decreased $21.9 billion, or 0.2 percent.The following graph shows real Personal Consumption Expenditures (PCE) through June (2005 dollars). Note that the y-axis doesn't start at zero to better show the change.
...
Real PCE decreased less than 0.1 percent. ... The price index for PCE decreased 0.2 percent in June
 Click on graph for larger image in graph gallery.
PCE decreased 0.2 in June, and real PCE decreased less than 0.1% as the price index for PCE decreased 0.2 percent in June. On a quarterly basis, PCE barely increased in Q2 from Q1 (this was in the GDP report Friday).
Note: The PCE price index, excluding food and energy, increased 0.1 percent.
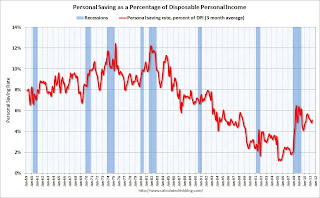
The personal saving rate was at 5.4% in June.
Personal saving -- DPI less personal outlays -- was $620.6 billion in June, compared with $581.7 billion in May. Personal saving as a percentage of disposable personal income was 5.4 percent in June, compared with 5.0 percent in May.
 This graph shows the saving rate starting in 1959 (using a three month trailing average for smoothing) through the June Personal Income report.
Real PCE has declined for three straight months - this was expected based on the weak GDP report, but this is very weak.


