by Calculated Risk on 8/10/2011 07:53:00 PM
Wednesday, August 10, 2011
FHFA, Treasury, HUD Seek Input on Disposition of REOs
From FHFA: FHFA, Treasury, HUD Seek Input on Disposition of Real Estate Owned Properties
The Federal Housing Finance Agency (FHFA), in consultation with the U.S. Department of the Treasury and Department of Housing and Urban Development (HUD), has announced a Request For Information (RFI), seeking input on new options for selling single-family real estate owned (REO) properties held by Fannie Mae and Freddie Mac (the Enterprises), and the Federal Housing Administration (FHA).Let me repeat the graphs I posted on Monday:
The RFI’s objective is to help address current and future REO inventory. It will explore alternatives for maximizing value to taxpayers and increasing private investment in the housing market, including approaches that support rental and affordable housing needs.
The combined REO (Real Estate Owned) inventory for Fannie, Freddie and the FHA decreased to 250,982 at the end of Q2 from a record 288,341 units at the end of Q1. The "F's" REO inventory increased 6% compared to Q2 2010 (year-over-year comparison).
 Click on graph for larger image in new window.
This graph shows the REO inventory for Fannie, Freddie and FHA through Q2 2011.
The REO inventory for the "Fs" increased sharply in 2010, but may have peaked in Q4 2010. However there may be a new peak when the foreclosure dam breaks.
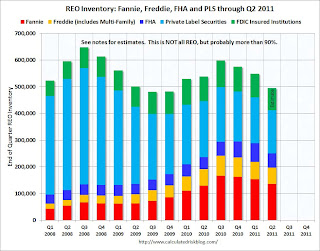
The second graph shows REO inventory for Fannie, Freddie, FHA, Private Label Securities (PLS), and FDIC insured institutions. (economist Tom Lawler has provided some of this data).
 Total REO decreased to 495,000 in Q2 from almost 550,000 in Q1.
As Tom Lawler noted: "This is NOT an estimate of total residential REO, as it excludes non-FHA government REO (VA, USDA, etc.), credit unions, finance companies, non-FDIC-insured banks and thrifts, and a few other lender categories." However this is the bulk of the REO - probably 90% or more. Rounding up the estimate (using 90%) suggests total REO is around 550,000 in Q2.
But this is only the current REO, there are also a large number of properties in the "90 days delinquent" and "in foreclosure" buckets. Here is a graph I posted on Sunday:
 This graph shows the delinquent and REO buckets over time. The delinquency data is from LPS, and the REO estimates are based on work by Tom Lawler and my own calculations.
The dashed lines are "normal" historical levels for each bucket. The 30 day bucket is only slightly elevated (as of June), and the 60 day buckets is somewhat elevated. But the glaring problems are in the 90 day and in-foreclosure buckets.
There are 4.1 million seriously delinquent loans (90 day and in-foreclosure). This is about 3 million more properties than normal.
Nick Timiraos at the WSJ noted:
Together with the Federal Housing Administration, the entities owned about 250,000 homes at the end of June, or around half of all unsold, repossessed properties. Another 830,000 homes backed by the entities are in some stage of foreclosure, according to Barclays Capital.Of those 2.1 million in the foreclosure process, less than half are related to the F's.
I'll try to add some proposal ideas soon.


