by Calculated Risk on 7/08/2011 10:25:00 AM
Friday, July 08, 2011
Employment Summary, Part Time Workers, and Unemployed over 26 Weeks
The only good news is that June is over.
There were few jobs created in June (only 18,000 total and 57,000 private sector). The unemployment rate increased from 9.1% to 9.2%, and the participation rate declined to 64.1%. Note: This is the percentage of the working age population in the labor force.
The employment population ratio fell to 58.2%, matching the lowest level during the current employment recession.
U-6, an alternate measure of labor underutilization that includes part time workers and marginally attached workers, increased to 16.2%, the highest level this year.
The BLS revised down April and May payrolls showing 44,000 fewer jobs were created than previously reported.
The average workweek declined slightly to 34.3 hours, and average hourly earnings ticked down. "In June, average hourly earnings for all employees on private nonfarm payrolls decreased by 1 cent to $22.99. Over the past 12 months, average hourly earnings have increased by 1.9 percent."
This is the second consecutive month with dismal numbers.
Through the first six months of 2011, the economy has added 757,000 total non-farm jobs or just 126 thousand per month. There have been 945,000 private sector jobs added, or about 158 thousand per month. This is a better pace of payroll job creation than last year, but the economy still has 6.98 million fewer payroll jobs than at the beginning of the 2007 recession.
There are a total of 14.1 million Americans unemployed and 6.3 million have been unemployed for more than 6 months. Very grim numbers.
Overall this was a weak report and reminds us that unemployment and underemployment are critical problems in the U.S.
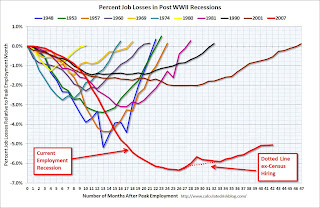
Percent Job Losses During Recessions
 Click on graph for larger image in graph gallery.
This graph shows the job losses from the start of the employment recession, in percentage terms - this time aligned at the start of the recession.
In the previous post, the graph showed the job losses aligned at maximum job losses.
In terms of lost payroll jobs, the 2007 recession is by far the worst since WWII.
Part Time for Economic Reasons
 From the BLS report:
The number of persons employed part time for economic reasons (sometimes referred to as involuntary part-time workers) was essentially unchanged in June at 8.6 million. These individuals were working part time because their hours had been cut back or because they were unable to find a full-time job.The number of workers only able to find part time jobs (or have had their hours cut for economic reasons) increased slightly to 8.552 million in June.
These workers are included in the alternate measure of labor underutilization (U-6) that increased to 16.2% in June from 15.8% in May. This is the highest level this year (highest since December 2010).
Unemployed over 26 Weeks
 This graph shows the number of workers unemployed for 27 weeks or more.
 According to the BLS, there are 6.289 million workers who have been unemployed for more than 26 weeks and still want a job. This was up from 6.2 million in May. This is very high, and long term unemployment is one of the defining features of this employment recession.
This was a terrible report and the only good news is Q2 is over.
• Earlier Employment post: June Employment Report: 18,000 Jobs, 9.2% Unemployment Rate


