 RSS Feed
 by Calculated Risk on 7/27/2010 09:00:00 AM
Tuesday, July 27, 2010
Case-Shiller: House Price indexes increase in May
IMPORTANT: These graphs are Seasonally Adjusted (SA). S&P has cautioned that the seasonal adjustment is probably being distorted by irregular factors. These distortions could include distressed sales and the various government programs.
S&P/Case-Shiller released the monthly Home Price Indices for May (actually a 3 month average).
This includes prices for 20 individual cities, and two composite indices (10 cities and 20 cities).
From S&P: For the Past Year Home Prices Have Generally Moved Sideways
Data through May 2010, released today by Standard & Poor’s for its S&P/Case-Shiller1 Home Price Indices, the leading measure of U.S. home prices, show that the annual growth rates in 15 of the 20 MSAs and the 10- and 20-City Composites improved in May compared to those reported for April 2010. The 10-City Composite is up 5.4% and the 20-City Composite is up 4.6%from where they were in May 2009. While 19 MSAs and both Composites reported positive monthly changes in May over April, only 12 of the MSAs and the two Composites saw better month-over-month growth rates in May than those reported in April.
 Click on graph for larger image in new window.
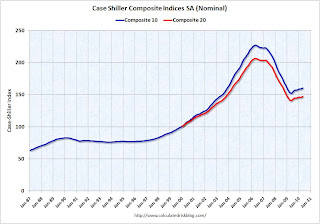
 The first graph shows the nominal seasonally adjusted Composite 10 and Composite 20 indices (the Composite 20 was started in January 2000).
The Composite 10 index is off 29.3% from the peak, and up 1.0% in May (SA).
The Composite 20 index is off 28.7% from the peak, and up 1.1% in May (SA).
 The second graph shows the Year over year change in both indices.
The Composite 10 is up 5.4% compared to May 2009.
The Composite 20 is up 4.6% compared to May 2009.
This is the fourth month with YoY price increases in a row.
The third graph shows the price declines from the peak for each city included in S&P/Case-Shiller indices.
 Prices increased (SA) in 15 of the 20 Case-Shiller cities in May seasonally adjusted.
Prices in Las Vegas are off 56.1% from the peak, and prices in Dallas only off 4.8% from the peak.
Case Shiller is reporting on the NSA data (19 cities with increasing prices), and I'm using the SA data. I'm not sure why S&P calls a 5% increase "moving sideways". Prices are probably starting to fall right now, but this will not show up in the Case-Shiller index for a few months.


