by Calculated Risk on 4/01/2008 02:30:00 PM
Tuesday, April 01, 2008
Normalized Construction Spending
Earlier this morning, I posted a couple of graphs on construction spending (see Construction Spending Declines in February). The key point was that non-residential construction spending appears to have peaked, and this appears to be the beginning of the non-residential construction slowdown!
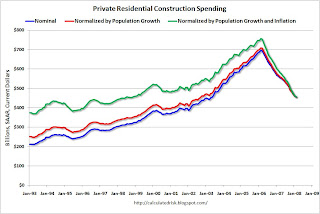
There were a couple of requests to see the first chart normalized by population. Yes, sometimes we do requests. Click on graph for larger image.
The first graph shows the nominal numbers in blue (seasonally adjusted annual rate) from the Census Bureau for private residential construction spending.
The red line is adjusting for population growth based on the monthly population number from the BEA (see line 32).
The green line is adjusting for inflation (using CPI from the BLS). We could use other inflation adjustments too (like the PCE deflator or CPI less shelter).
Clearly the inflation adjustment is more important than the population adjustment.
Another measure of new housing investment is Residential Investment (RI) as a percent of GDP. I expect RI as percent of GDP to bottom towards the end of 2008. (note: this says nothing about existing home prices - those will likely fall for some time).
The second graph shows the same three lines for private non-residential construction spending.
Once again, the inflation adjustment is more significant than the population adjustment.
It appears non-residential construction spending has peaked and will now probably decline throughout 2008.


